CGU team launches map to inform Californians about energy construction projects

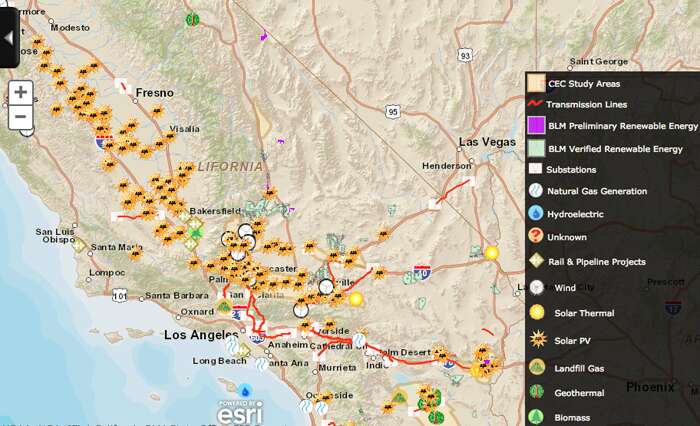
Researchers at Claremont Graduate University (CGU) have created an interactive online map that makes it easier for Californians to know when energy infrastructure projects are planned for their communities.
Energy Maps shows the locations of more than 6 000 major solar wind natural gas and power line projects that are in the planning process throughout the state.
Until now there has been no easy way for people to know if these projects would be built near homes or businesses until it was too late to provide input that could substantively affect project outcomes. Energy Maps offers an early warning system allowing citizens to potentially have a voice in the project design earlier in the planning processes.
“The construction of natural gas wells or power lines can be very disruptive to communities ” said Hal T. Nelson the CGU professor behind the map. “In the past we’ve seen citizens go to court to block projects after construction was already underway. That’s inefficient and expensive and we think a publicly available map of proposed projects has the potential to lead to better outcomes and less litigation.”
California lawmakers have launched energy policies that require one third of the state’s electricity be generated by renewable sources by 2020 which has led to a boom in construction of infrastructure projects. California is also undergoing a revitalization of its oil and gas industry as operators are rapidly expanding drilling operations in the state.
These types of projects create social dilemmas: They provide much-needed economic development and reliable oil gas and electricity supplies but come with tradeoffs such as environmental degradation health and safety risks and property value declines for communities next to them.
At its launch Energy Maps depicts more than 5 800 proposed and recently permitted oil and gas wells 215 solar generation facilities 28 major new transmission lines and scores of other energy infrastructure projects. Although the projects are clustered most heavily in California’s Central Valley and deserts many are located in densely populated urban and suburban centers.
“Seeing all of these projects mapped out like this is really the only way to grasp the size of the renewable energy corridors that encompass huge swaths of the state ” Nelson said. “I think most people will be shocked when they see how much land is being utilized for this purpose.”
The map uses data from state agencies and energy industry trade publications. It is searchable by address and can be sorted by layers representing the different energy technologies (solar wind natural gas generation transmission lines). The map also includes specific data for each entry such as the name of the developer and the size of the project.
The map is also enabled so that users can upload information about projects that are not currently on the map. This “crowdsourcing” of new project information from reporters community members local governments and other stakeholders can complement the information already on the map that was taken from government agencies and trade publications.
Energy Maps builds off previous work by Nelson on reducing conflict around energy infrastructure siting. His other research interests include political economy climate policy civic engagement and decision-making.
Nelson and his team of graduate students built the map with the help of a two-year $127 000 grant from the John Randolph Haynes and Dora Haynes Foundation.